Understanding vehicle license fees is essential for new drivers, existing vehicle owners, and auto dealerships alike. These fees, which support transportation infrastructure, are influenced by various factors that require careful consideration. This guide unpacks the crucial components involved in calculating vehicle license fees. From the types and weights of vehicles, through engine specifications, to the impact of location and vehicle value, each chapter will provide valuable insights to empower readers in navigating each aspect of vehicle registration costs.
Weight, Type, and Plates: How Vehicle Characteristics Shape License Fees
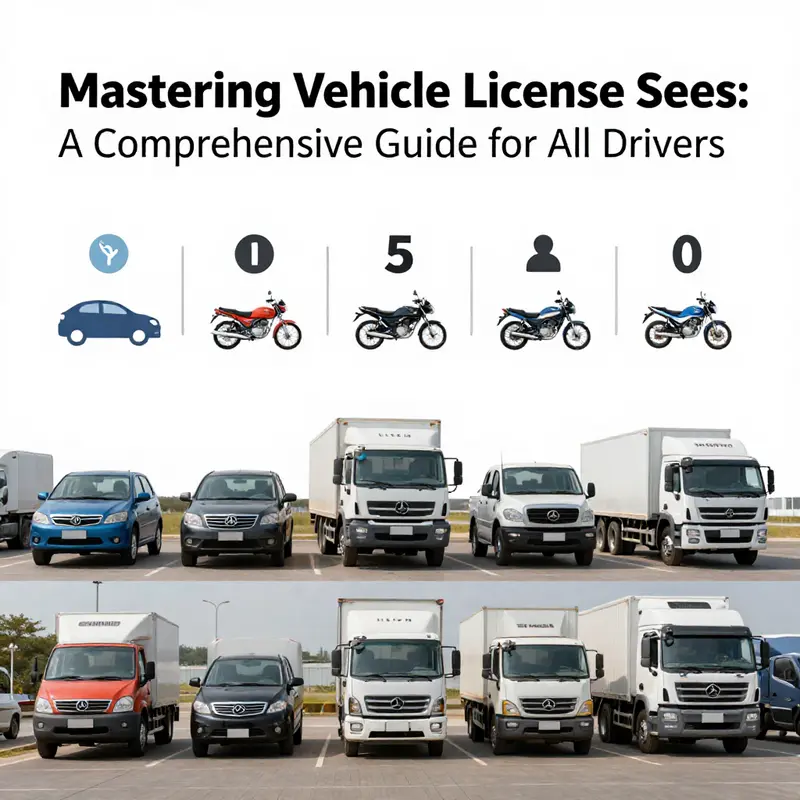
Fees charged for vehicle registration are rarely random. They are the product of policy choices about how to fund infrastructure, regulate transportation, and incentivize or discourage certain vehicle classes. In the landscape of license fees, two core ingredients stand out for nearly every jurisdiction: the type of vehicle and its weight. These factors interact with plate status and other surcharges to produce a final price that owners pay each year or each term. Understanding these elements in concert helps owners anticipate what their registration costs will be and why a seemingly similar vehicle might incur a different annual bill. While the precise numbers vary from state to state, the underlying logic remains steady: the more a vehicle weighs and the more it fits a given category, the higher the fee, within the bounds of policy choices that reflect environmental goals, road wear considerations, and administrative costs.
To begin with vehicle type, the categories used for fee assessment are fairly straightforward at first glance but carry nuances that matter in practice. Passenger cars, trucks, motorcycles, and commercial vehicles all belong to distinct lanes in the fee system. Each category is associated with a baseline charging structure, which is then adjusted by other factors such as weight and plate type. The reason this matters is not merely administrative convenience; it captures how different vehicles interact with road use. A passenger car, typically designed for personal conveyance and everyday commuting, generally consumes infrastructure in one way. A commercial vehicle, by contrast, often carries heavier loads and travels longer distances, potentially exerting more wear on roads and contributing differently to maintenance costs. A motorcycle, lighter and more specialized, follows its own trajectory of fees. Recognizing these distinctions helps explain why a registration bill for a compact car and a similar-sized pickup could diverge even if other elements appear similar at first glance.
Weight classification sits at the heart of many fee calculations. In jurisdictions such as Florida, the Vehicle License Fee (VLF) and related charges are directly linked to the vehicle’s weight class. Heavier vehicles, or those with higher curb weights and gross vehicle weight ratings, typically push fees higher. The logic is twofold: heavier vehicles tend to cause more road wear and may also have different insurance and regulatory considerations. The weight measure used for these calculations is often not a single static figure but a class system. This means vehicles are grouped into weight ranges, and each range corresponds to a particular fee tier. The practical effect is that two vehicles within the same broad category—say two passenger cars—can face different costs if one falls into a heavier weight class than the other. This structure helps municipalities and states balance revenue with policy objectives, including environmental aims and traffic management strategies.
The way weight interacts with plate status adds further texture to the calculation. The plate you choose—whether a standard plate, a specialty plate, or an electric-vehicle (EV) plate—can alter the total due at registration. Standard plates typically carry the base package of fees, with weight-based adjustments layered on top. Specialty plates, which fund specific causes or programs, include an additional plate-related surcharge or cost that sits alongside the base and weight components. Electric vehicle plates can carry their own unique considerations. In many places, EVs benefit from incentives or reduced fees tied to their lower emissions, even as some jurisdictions maintain a separate fee structure to ensure that charging infrastructure and regulatory oversight receive appropriate funding. The net result is that the same car with a standard plate might incur a different total than the same car with a specialty or EV plate, depending on the jurisdiction’s policy mix. These plate-driven differences are not merely cosmetic; they reflect broader policy aims, such as supporting environmental goals or enabling targeted funding for road upkeep and safety programs.
The Florida context, which has been a focus of recent discussions about license fees, illustrates how these components come together in a concrete, policy-laden example. In Florida, the base registration fee is a fixed charge, but it is complemented by the VLF, which scales with weight class. This means that a heavier vehicle pays more in the VLF portion of the bill, all else equal. Additionally, plate status contributes its own layer of costs or incentives. Electric vehicles, for instance, may enjoy or be subject to different treatment compared with internal combustion engine vehicles, depending on evolving state policies designed to encourage or balance environmental considerations. The interplay among vehicle type, weight class, and plate status creates a composite fee that can feel opaque at first glance but breaks down cleanly when approached as a structured, policy-driven calculation rather than a single lump-sum number. For readers navigating these waters, the goal is to translate a vehicle’s physical and functional profile into the corresponding fee category, then apply the appropriate surcharges or credits associated with plate choices.
When thinking through a hypothetical example, picture a few scenarios that illuminate the process without becoming mired in numbers. A compact passenger car with a modest curb weight will typically sit in a light-weight class and pay a relatively modest VLF, paired with a standard plate that carries the base set of fees. Shift to a mid-size or full-size sedan with a heavier curb weight, and the vehicle is likely to move into a heavier weight class, nudging the VLF higher. If that same car owner opts for a specialty plate—perhaps one that signals support for a particular cause—an additional plate-related fee or surcharge can alter the total, even if the weight class remains the same. Now consider a pickup or a small commercial vehicle. These chassis are designed to bear heavier loads and often register in a higher weight class, which tends to push the VLF up and could involve different surcharges or regulatory fees associated with commercial use. In such cases, the difference in cost is a direct function of how the weight class and vehicle type map onto the fiscal framework established by the state, with plate status acting as a lever that policy makers can pull to achieve broader objectives.
How do owners translate this structure into an estimate for their own vehicle? A practical approach begins with identifying the vehicle’s classification. What category does the vehicle fall into? Is it a passenger car, a light-duty truck, a motorcycle, or a commercial vehicle? Once that is established, the next step is to determine the weight class. This can be tricky if a vehicle’s weight varies with load, but the weight class used for fee calculations is typically based on the manufacturer’s rating or the vehicle’s declared weight as recorded in official registries. It is not uncommon for weight to be reported as the gross vehicle weight rating (GVWR) or as the curb weight, depending on the jurisdiction. In Florida, for instance, weight class plays a decisive role in computing the VLF, and heavier classes incur higher charges in line with the policy rationale described above. The third step is to decide on the plate status. Will the owner select a standard plate, a specialty plate, or an EV plate? The choice adds a surcharge or discount that can materially alter the total. Finally, the calculation is assembled by combining the fixed base registration fee with the weight-based VLF and any plate-related costs plus any other ancillary charges that may apply, such as regional or municipal surcharges, local fees for certain plate options, or regulatory assessments that are not tied to weight or type but to governance requirements.
To help owners navigate these components with confidence, many jurisdictions publish official fee schedules that lay out the exact charges for each weight class and vehicle type, along with the plate-specific costs. In Florida, for example, the DMV’s published fee chart and related tools provide the framework for calculating the total. Practically, owners can use the Florida Registration Calculator to cross-reference a vehicle’s type and weight with current fee charts to arrive at an accurate total. That tool leverages up-to-date state regulations, converting weight classes and plate options into a concrete bill. While calculators can be extremely convenient, they are only as trustworthy as the data they pull from. Therefore, owners should verify any estimate against the official fee chart published by the state, especially because the numbers can shift with annual policy updates, new tax surcharges, or environmental incentives that affect the final tally. The broader lesson is that effective estimation relies on anchoring the calculation in the policy framework rather than guessing based on a single dimension of the vehicle profile.
In practice, one of the most helpful ways to ground the calculation is to begin with a clear list of the vehicle’s key characteristics: the category, the weight class, and the planned plate type. With those in hand, a disciplined approach becomes possible. Start with the base registration fee. Then add the VLF according to the weight class, noting how much the heavier end of the spectrum will add versus the lighter end. Next, apply the plate-related charges or credits tied to the chosen plate type. If the vehicle is electric, confirm whether any EV-specific adjustments are in place—some jurisdictions provide credits, exemptions, or reduced fees to support cleaner transportation, while others restructure charges to ensure ongoing funding for charging infrastructure and regulatory oversight. Finally, take into account any additional surcharges that may be imposed by county, city, or transit authorities. Each jurisdiction has its own constellation of extras, and some of these can be surprisingly consequential, especially for vehicles that straddle multiple categories or for owners who switch plate types during the registration period.
The objective of laying out these steps is not simply arithmetic. It is about recognizing how policy choices, environmental goals, and administrative logistics shape a fee that otherwise might seem arbitrary. When people understand that fee structures are built from a few essential ingredients—vehicle type, weight class, and plate status—and that these ingredients are adjusted by broader policy objectives, the process of estimation becomes more transparent. It is easier to anticipate fluctuations in the annual bill and to understand how a particular vehicle’s footprint—the combined effect of its mass and its use—translates into a license fee that funds road maintenance, safety programs, and the administrative apparatus that keeps the system running smoothly.
For readers who want to explore the policy context behind these numbers, a closer look at state-level discussions on how regulations affect licensing and registration can be enlightening. See the broader discussion on how state rules impact driver licensing for a sense of how policy levers beyond the vehicle itself can influence the overall cost landscape and the administrative framework surrounding vehicle registration. state rules impact on driver licensing.
In any case, the practical takeaway remains consistent: knowing the vehicle’s type, weight class, and plate choice is the key to deciphering the fee. Tools such as the Florida Registration Calculator can be very helpful, but they should be used alongside the official fee chart to confirm the current structure and any recent changes. As a final reminder, always consult the official resources for the most accurate, up-to-date information before submitting a registration payment. The official DMV fee chart provides the authoritative reference for all applicable fees based on vehicle classification and weight, and it offers a precise map of where the calculation starts and how the total bill is assembled. For readers seeking the official framework, the Florida DMV Fee Chart is the definitive source of truth to verify the components described here and to ensure accuracy when calculating a specific vehicle’s license fees. Florida DMV Fee Chart.
Sizing the Fee: How Engine Displacement Shapes Vehicle License Costs—and Why Power Matters Less
Vehicle license fees are more than a simple annual toll; they are a compact snapshot of policy choices about who pays for roads, who uses more space, and who should be nudged toward more efficient driving. Across the globe, these fees blend several factors: vehicle type, weight, value, location, and, crucially, engine size. Among these, engine displacement often takes center stage. The displacement of an engine, typically measured in cubic centimeters (cc) or liters, serves as a proxy for the size of the mechanical heart of a vehicle and, by extension, the amount of fuel it can burn and the emissions it can produce. In many regulatory systems, that proxy translates into a tiered pricing structure, where small engines pay one rate and larger engines pay progressively higher rates. This reflects a policy logic that aims to balance revenue with environmental and congestion considerations, while preserving access to mobility for various household needs. Yet this approach sits within a broader tapestry of rules. Some jurisdictions weigh the engine size against the vehicle’s value, its weight, or its age; others assign separate fees for air quality testing, or add surcharges for heavy-duty applications. The picture can look different from one place to the next, but the underlying idea remains clear: the larger the engine, the greater the potential environmental and infrastructure impact, and thus the higher the license cost. To understand the mechanics behind the numbers, it helps to walk through how a typical displacement-based system operates, what it signals to drivers, and where horsepower—the other common measure people ask about—fits into the regulatory landscape. In most licensing frameworks, horsepower itself is largely not a direct determinant of the license fee. Instead, horsepower enters the conversation in related domains such as performance assessments, insurance risk calculations, or specific emissions tests. When a jurisdiction does rely on horsepower for pricing in some capacity, it does so as a secondary or supporting metric, not as the primary lever for calculating the annual or biennial fee. This distinction matters for drivers who consider performance upgrades or vehicle modifications. If your goal is to optimize the fees you pay, knowing whether displacement, weight, or value carries the weight is essential—and horses and horsepower become a different kind of conversation, often about performance, safety, or risk rather than cost per se. In practical terms, the steps to estimate a license fee in a displacement-based system begin with the engine size. Engineers express displacement in cc, and the regulatory tables translate those numbers into discrete bands. A vehicle with a smaller engine enters a lower tier, and a larger engine falls into a higher tier. The tier then governs the base amount due for a given licensing period, whether that is annually or biennially, and additional adjustments may apply depending on the vehicle’s location. The logic often resembles a staircase: small steps at lower displacements and wider gaps as displacement grows, designed to reflect diminishing marginal benefits from larger engines relative to the public costs they impose. A helpful illustration of this tiered approach can be found in a major city-state framework where the annual license fee is directly tied to engine capacity. Vehicles up to a threshold—say, 1,500 cc—enter a lower-cost bracket, while those surpassing 1,500 cc but not exceeding 2,500 cc appear in a higher bracket. The example figures—such as S$5,074 for the former tier and S$6,972 for the latter—underscore the scale of difference and the policy intent behind it: to reward smaller, potentially more fuel-efficient engines while still allowing access for larger engines when needed. Such tiered schemes are not merely administrative conveniences; they embody political choices about environmental responsibility, urban air quality, noise, and the expected wear and tear on roads. They are designed to align the price of vehicle access with the scale of the engine’s potential impact on public resources. At the same time, these systems acknowledge that displacement is not the sole determinant of a vehicle’s overall burden. A heavy, well-made vehicle with a modest engine might still impose substantial costs through weight-related wear and tear, tire wear, and maintenance needs. Conversely, a high-displacement engine in a lightweight or efficient vehicle could deliver strong performance while delivering lower overall emissions per mile than an older, smaller engine in a heavier chassis. This nuance helps explain why many jurisdictions supplement displacement-based fees with other criteria. Vehicle value, for instance, can influence the fee because a higher-value vehicle may contribute more to tax bases or replacement costs for road infrastructure. Weight can reflect the physical burden a vehicle places on pavement and the energy required to move it. Location matters because the same model can face different tariffs in different provinces, regions, or municipalities, depending on local policy priorities, infrastructure budgets, and environmental goals. The result is a multifaceted calculation that aims to balance revenue, equity, and environmental stewardship. For readers seeking practical clarity, it helps to understand where horsepower fits into this framework. In most cases, horsepower does not drive the licensing cost directly. It is more commonly a factor in other regulatory or market processes—insurance rating, performance testing, or emissions testing—where power and performance intersect with risk and compliance. In some advanced analytical settings, investigators might attempt to estimate horsepower from performance data, using methods like ET (elapsed time over a quarter mile) or trap-speed measurements. These tools rely on vehicle weight, acceleration, and drag characteristics to infer power. Yet they serve as performance analysis instruments rather than official determinants of licensing fees. The regulatory calculus remains anchored in displacement as the primary metric, supplemented by other inputs that reflect broader societal concerns. When drivers upgrade or modify their engines, the impact on licensing costs can be tangible. Increased displacement commonly triggers a higher fee, even if the vehicle gains fuel economy or reduces certain emissions. This dynamic can seem counterintuitive to some enthusiasts who associate horsepower with better performance but not necessarily with higher road costs. The policy logic, however, emphasizes that the capacity to burn fuel and the potential for emissions scale with engine size, driving the need for proportionate public funding of road infrastructure and environmental safeguards. To estimate a candidate vehicle’s license fee in a displacement-centric regime, one would start with the engine displacement and identify the corresponding tier in the official fee table. The next step is to apply any location-based adjustments, such as regional surcharges or exemptions for certain categories of vehicles, like electric or hybrid designs in some jurisdictions. It is important to note that the exact figures and brackets vary by country, state, or province, and within large federations, even by city or district. Because the policy landscape can change over time, drivers and owners should consult the local licensing authority for the most up-to-date calculations. The local authority often maintains an online calculator or a published tariff schedule that shows the exact thresholds and corresponding fees. In the absence of a simple calculator, individuals can approximate by mapping their engine displacement to the nearest bracket and then applying any additional surcharges or discounts that apply to their category. The broader article you are reading seeks to illuminate these processes in a way that remains anchored in real-world examples while avoiding overly mechanical descriptions. To that end, it is helpful to consider how this topic relates to the larger ecosystem of vehicle licensing and regulation. For readers who want to explore related governance themes in a broader context, a discussion of how state rules impact driver licensing can provide useful perspectives on how policies vary and why they change over time. See the discussion on state rules impact on driver licensing for a consolidated view of the jurisdictional variability that shapes licensing costs across regions. state rules impact on driver licensing. In tone and substance, this broader map helps explain why displacement-based pricing is common in some places, while other regions pair displacement with weight, value, or age-based adjustments to reflect local policy priorities. A crucial takeaway for drivers and policymakers alike is that engine size remains a clear and widely understood signal of regulatory intent. When you see a higher fee as engine size grows, the logic is rarely about punitive pricing. It is usually about aligning the practical costs of vehicle operation, maintenance, and environmental management with the public costs of roads, congestion, and air quality interventions. The goal is to induce behavior and choices that can reduce externalities without excluding mobility or imposing blanket inequities. That is the balancing act embodied in many licensing regimes and is a reminder that understanding the mechanics behind the fee yields practical benefits: you can anticipate how a modification or upgrade may alter the fee, plan for changes in ownership costs, and compare alternatives with a clearer sense of the full financial picture. For those navigating the maze of licensing—whether they are new buyers, owners contemplating a power upgrade, or advocates seeking more equitable policies—the displacement-centric logic remains a core reference point. It anchors the discussion in tangible terms that most drivers recognize: engine size is not merely a technical specification; it is a public policy instrument that helps fund the systems we all rely on to move, connect, and sustain our communities. External resource: https://www.mot.gov.sg/transport-licensing/vehicle-licensing-fees
Value on the Ledger: How Vehicle Worth Shapes License Fee Calculations Across States
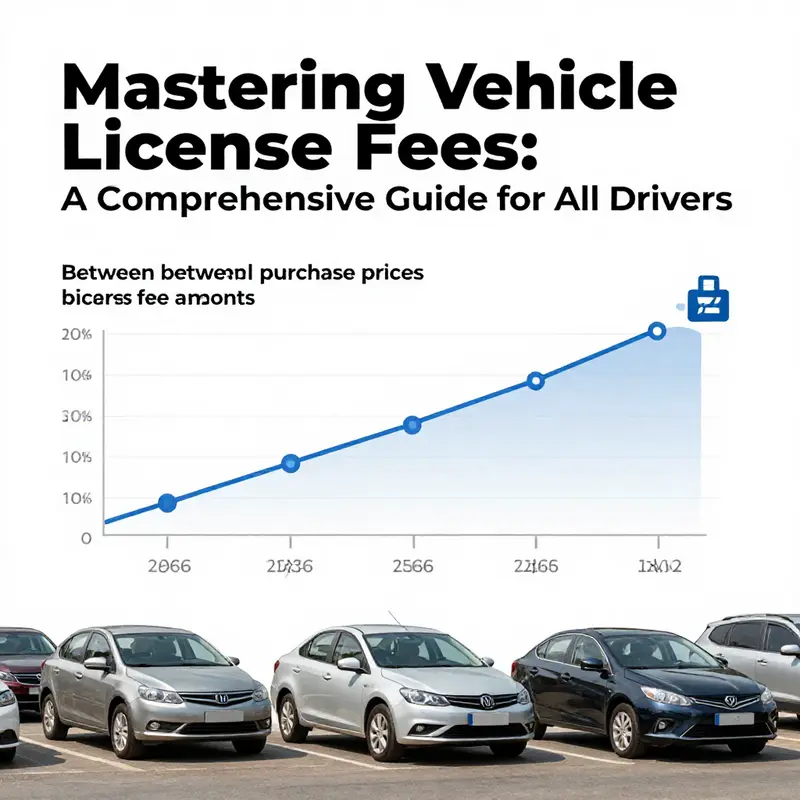
The price of a vehicle does more than determine its purchase cost and expected resale value. In many places, the vehicle’s worth also helps determine the ongoing price of keeping it on the road. Vehicle license fees are not uniform charges hidden in the fine print; they are a deliberate instrument that ties public revenue to the policy objectives a state or province wants to achieve. Because licensing fees fund road maintenance, safety programs, and regulatory oversight, the decision to tie fees to value instead of, say, a fixed rate per year reflects a philosophy about fairness, burden-sharing, and environmental impact. When you step back from the mechanics of registration and think about why a fee exists at all, the role of vehicle value begins to make practical sense. It translates the idea that a higher-end car, with its typically higher purchase price and potentially greater use of city roads, should contribute more to the upkeep of infrastructure than a modest, economy-class vehicle. The result is a tax-like component that varies with the vehicle’s current market standing, not merely with its age or weight, though those factors may still play a role in many jurisdictions. In this sense, value-based calculations blend economic reality with public policy, creating a dynamic landscape in which the cost of licensing can swing with market conditions, the vehicle’s lifecycle, and the regulatory priorities of the issuing authority.
Across the United States, the approach to factoring vehicle value into license fees is far from uniform. Some states lean heavily on the market value of a vehicle, applying a depreciation-adjusted percentage of that value as the annual or biennial fee. Others adopt flat rates that ignore value altogether, while still others combine value-based charges with weight, age, and emissions components to form a composite fee. The practical consequence is both subtle and striking: two identically equipped cars can end up with very different registration bills simply because they live in different states, counties, or even municipalities that choose distinct funding formulas and environmental policies. This variability is not merely an academic concern; it affects consumer decisions, budgeting for households, and how businesses plan fleets. It also poses a challenge for consumers who move between jurisdictions, for which there is often a back-end adjustment period to align with the new regime’s valuation method. The policy rationale behind value-based licensing is straightforward: if a vehicle is worth more, it should bear a correspondingly higher share of the costs associated with road wear, congestion, and the environmental footprint that vehicle represents. Yet the implementation is nuanced and invites careful scrutiny.
Consider jurisdictions that place value at the center of the calculation. California and New York, for example, rely on a value-based assessment framework. In these states, the license fee is tied to the vehicle’s current market value and is adjusted as the vehicle ages, often through depreciation schedules that gradually reduce the value on which the fee is calculated. In outline, the process begins with a determination of the vehicle’s value, typically anchored to market data, and then applies a depreciation factor that mirrors how value erodes over time. The result is a fee that declines as the vehicle becomes older, even if it continues to accumulate miles on the highway. This approach acknowledges that while older vehicles may still be reliable and functional, their contribution to infrastructure costs may be proportionally lower than that of a newer model, given the natural depreciation in value and the evolving technology that can affect maintenance costs and environmental performance. The depreciation, in turn, is not merely a private calculation; it interacts with policy imperatives such as emissions standards and fuel efficiency targets that can influence how aggressively value-based charges are adjusted over a vehicle’s life cycle.
The value-based approach also interacts with other charge elements that a state may layer on top of the base value-derived amount. In some places, the calculation is complemented by weight-based surcharges, which account for the physical load a vehicle imposes on road surfaces and bridges. Heavier vehicles tend to cause greater wear, and thus some jurisdictions assign an additional fee component that scales with weight. Emissions-based adjustments may also appear, aligning the price of registration with the environmental footprint of the vehicle. In practice, this can mean that a single vehicle could face a higher total fee in a jurisdiction that emphasizes environmental accountability, while a similar vehicle might incur a lower fee in a state that places less emphasis on emissions in its licensing scheme. The result is a composite cost that reflects multiple dimensions of vehicle use, value, and policy goals, rather than a single, one-dimensional calculation.
From a consumer perspective, understanding value-based licensing begins with grasping how a vehicle’s current market value is established. In many states, this is not a private appraisal but a composite derived from widely used valuation sources, such as published market data, trade-in estimates, and depreciation schedules. The depreciation schedule is a critical component; it translates the idea of value erosion into a numerical factor that reduces the base value used for the fee calculation as the vehicle ages. The rate and shape of depreciation can vary by jurisdiction and may account for factors such as the vehicle’s age, odometer readings, and overall condition. While a newer car generally holds a higher value, the rate at which value decays differs depending on the type of vehicle, its popularity in the market, and broader economic conditions. In a robust market, depreciation might proceed quickly for some segments, while in a slower market, the same vehicle could retain value longer. These fluctuations naturally feed into monthly or annual budgeting for vehicle ownership and create a sense of how policy choices in the DMV and related agencies influence everyday costs.
The mechanics of applying depreciation to value also reveals why the process can feel opaque to the average driver. It is not simply a matter of multiplying a fixed percentage by a sticker price and calling it a day. The value used for licensing is not always the original purchase price; it is the vehicle’s current value, which requires data inputs about how the market has changed since the vehicle left the showroom floor. These inputs may involve regional market data, the vehicle’s make and model, its mileage, and its condition. The result can be a fee that rises or falls in response to market swings, a dynamic that some drivers find frustrating when the wallet is tighter or when they believe the car’s condition does not justify the assessment. Yet from a policy standpoint, tying fees to value offers a mechanism to align license revenue with the real-world use and impact of the vehicle, which in turn can support more stable funding for transportation infrastructure and regulatory programs.
To navigate this landscape, the first step for most vehicle owners is to determine the local rules governing license fees. This starts with visiting the state or provincial DMV or equivalent agency website, which will describe whether the calculation uses a value-based method, a flat rate, or a hybrid approach. The documentation often includes a depreciation schedule or a reference to current market value sources, plus any fixed charges that must be added on top of the base value-derived amount. For many readers, the experience of exploring these materials is a reminder of how decentralized transportation policy remains across the country. The exact formula is rarely identical from one jurisdiction to another, and even neighboring counties can impose different surcharges or exemptions depending on local budget needs and environmental targets. In practical terms, this means a vehicle that is perfectly identical in make, model, and age can incur different registration costs simply because of where it is registered.
A practical consequence of this heterogeneity is that families, fleets, and individual owners must be prepared to perform a small amount of local research when relocating or purchasing a vehicle in a new jurisdiction. One useful way to approach this is to look at the broader framework that a jurisdiction uses: value-based, flat, or a hybrid approach. In jurisdictions that rely heavily on valuation, you will want to gather the latest market data and understand the depreciation schedule tied to your vehicle’s age. In flat-rate jurisdictions, the challenge shifts toward understanding any base fees, local surcharges, and how those charges might change with vehicle weight or emissions in approved categories. In hybrid systems, you will need to map how each component interplays with the others to arrive at the total due. Each approach has its logic, and each reflects a balancing act between revenue predictability for public budgets and fairness for vehicle owners who contribute to the shared road system.
For readers who want a deeper, comparative account of how value affects license fees across the United States, the National Conference of State Legislatures (NCSL) provides a state-by-state reference that synthesizes these approaches and the policy rationales behind them. This resource helps illuminate the wide spectrum—from value-centric systems to those that emphasize weight or environmental considerations—and highlights how policy choices translate into actual dollar figures for drivers. While the specifics change, the overarching principle remains: value-based charges anchor the cost of licensing in the vehicle’s economic footprint, while other variables refine the final amount to reflect usage, safety standards, and environmental goals. If you are assessing your own registration costs or planning a move across state lines, consulting this kind of centralized guide alongside your state DMV calculator can provide a clearer sense of what to expect and why.
This broader view also invites reflection on how licensing policies intersect with other regulatory domains described in this article. For example, licensing decisions are shaped not only by value and weight, but also by inspection regimes, emissions testing, and driver-licensing rules that vary by state. The interplay of these components can create a web of charges and requirements that is difficult to track without a cohesive map. The linked discussion of state rules impacting driver licensing offers a lens for understanding how these policy choices cohere across the system and why a reader might see variations in fees that align with the overall design of licensing programs rather than with the mere cost of vehicle ownership. State Rules Impact on Driver Licensing
In sum, whether a vehicle’s value is the central pillar of the fee or one part of a broader mix, the end result is a licensing charge that is entwined with the economics of the vehicle and the public priorities of the jurisdiction. Drivers who recognize this connection are better prepared to anticipate registration costs, compare options when buying or relocating, and engage in more informed discussions with public agencies about how road funding and environmental goals are reflected in the price they pay each year or every two years. The value-driven element reminds us that licensing is not a tax only on possession but a contribution to the ongoing, shared enterprise of maintaining a road system that accommodates growth, advances safety, and pursues cleaner transportation futures. For many, the learning curve is well worth the effort because it translates a seemingly opaque administrative task into a tangible reflection of where policy, market forces, and personal vehicle choices intersect on the open road.
External reference for ongoing detail and updates on how vehicle registration fees are structured by state: https://www.ncsl.org/research/transportation/vehicle-registration-fees.aspx
Where Jurisdiction Meets the Wheel: How Location Shapes Vehicle License Fees and the Path to Accurate Calculation

Location is the primary driver of the final license fee. While engine displacement, vehicle type, weight, and vehicle value appear universal, the numbers attached to those factors are written by local policies at the city, county, state, or provincial level. The result is a landscape of rules that can look familiar in structure but differ in scale from place to place. Understanding this landscape helps you estimate fees accurately and anticipate how moving residence, crossing borders, or adding a vehicle can change annual licensing costs. The core factors remain recognizable, but local rates, rounding rules, and exemptions turn a generic calculation into a jurisdiction specific equation that reflects local priorities such as road maintenance funding, emissions goals, or incentives for certain technologies. Engine size often remains central, but the exact relationship to the fee varies; some places apply modest surcharges for small increases while others use more granular bands. Vehicle type matters too, with passenger cars, buses, and trucks sometimes taxed differently, and weight or gross vehicle weight rating used for larger vehicles. Exemptions and incentives for electric or hybrid propulsion, or for commercial fleets, can add further nuance and complexity. The timing of the charge also depends on local policy, such as annual versus prorated calculations or adjustments on mid year transfers of ownership. Because rules change by jurisdiction and over time, it is essential to consult the official fee schedules or calculators from the local motor vehicle department. When planning a purchase or a move, consider building a simple pro forma to estimate how changes in location could alter annual fees and check authoritative sources for current guidance. The broader takeaway is that location shapes not only the rate but the overall mix of charges that accompany licensing, including emissions tests, plate fees, and renewal costs, which together form the true cost of vehicle ownership.
Final thoughts
Grasping the intricacies of vehicle license fee calculations is crucial for all involved in vehicle ownership or sales. By understanding how vehicle types, engine specifications, value, and location interact, drivers and dealerships can make well-informed decisions that influence their budgeting and compliance strategies. Ensuring you are well-versed in these calculations can lead to significant financial savings and a smoother driving experience. Equip yourself with this knowledge to navigate the vehicle registration landscape effectively.